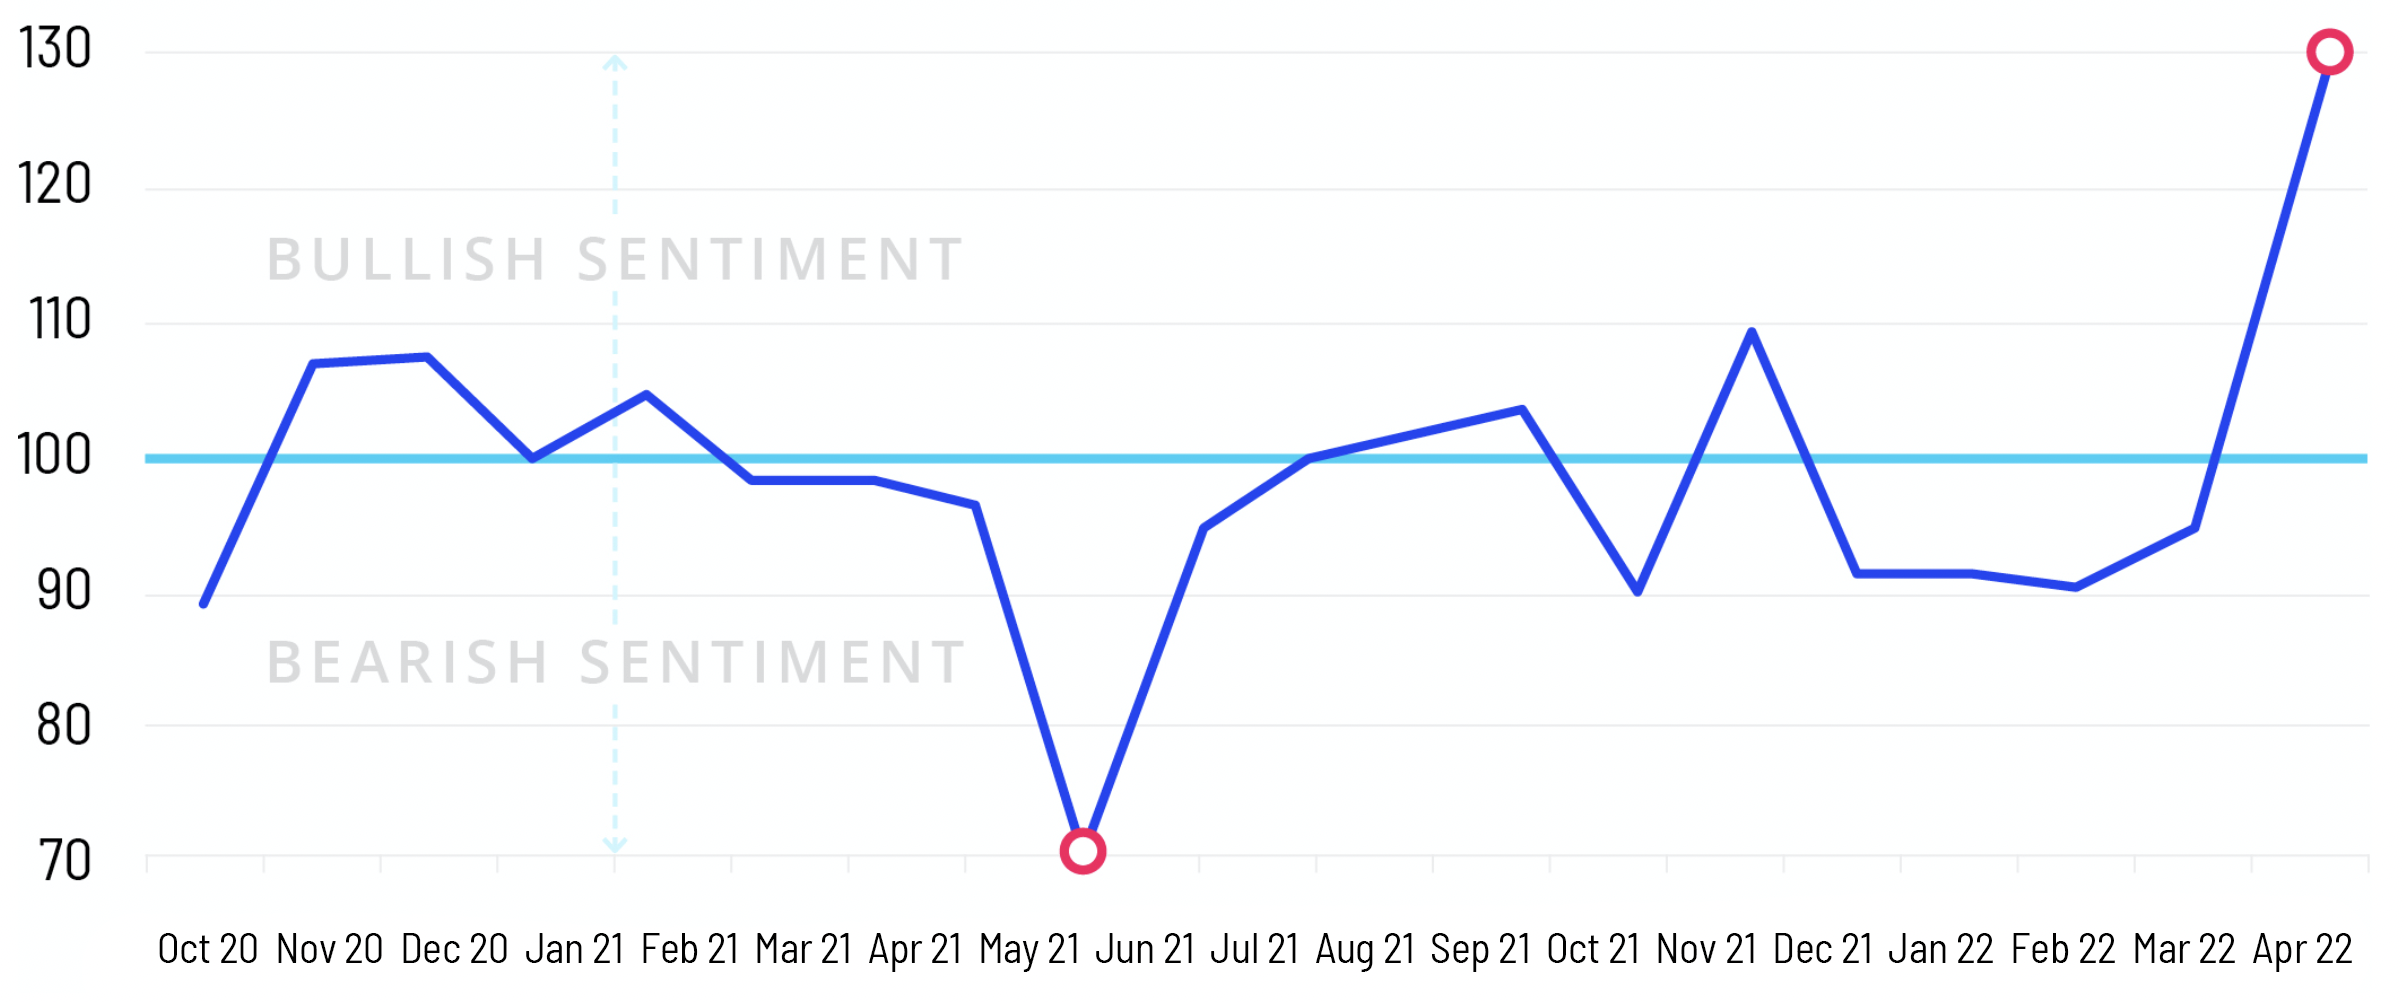
The SERIX® is a pan-European client sentiment that informs as to whether retail investors have speculated on a rising or falling market. Use the SERIX® to compare how the client sentiment has changed (in terms of directionality or strength of sentiment) over time on a monthly basis.
The calculation is centred around 100. An index figure of >100 represents a bullish sentiment where more investors expect a rising market. An index figure of <100 represents a bearish sentiment where more investors expect the market to fall.
BULLISH TRADES
Number of trades on long instruments bought + number of trades on short instruments sold
BEARISH TRADES
Number of trades on long instruments sold + number of trades on short instruments bought
Long instruments | Short instruments | |
Buy | 300 trades | 150 trades |
Sell | 200 trades | 350 trades |
Total | 1000 trades | |
The further away the index figure is from the centre point (100), the stronger the sentiment.